Latest Health Insurance Incurred Claim Ratio 2025 | Top Health Insurance Companies List
Every year, the IRDAI annual report triggers a fresh round of discussions around “which health insurer is best” based on the Incurred Claim Ratio (ICR). “The December 2025 data from the IRDAI Annual Report (FY 2024–25) is no different. However, before drawing quick conclusions, it is important to understand what ICR actually tells us — …
Every year, the IRDAI annual report triggers a fresh round of discussions around “which health insurer is best” based on the Incurred Claim Ratio (ICR).
“The December 2025 data from the IRDAI Annual Report (FY 2024–25) is no different. However, before drawing quick conclusions, it is important to understand what ICR actually tells us — and, more importantly, what it doesn’t.”
What is Incurred Claims Ratio (ICR)?
Incurred Claim Ratio (ICR) represents the ratio of total claims incurred (paid plus outstanding) to the total premium earned by an insurer during a specific period. It broadly reflects how much of the premium collected is being used to meet claim obligations.
As an example a 70% incurred claims ratio means that for every Rs 1000 of premium earned in a given accounting period, Rs 700 is paid back in the form of benefits (claims). Incurred Claim ratio is the ratio of the claims settled to the premium received.
So, how to analyze the ICR data? Whether a Non-life Insurance company which has say ICR of 110% is better than a company which has incurred claims ratio of say 75%?? Let us now understand this point.
If ICR is greater than 100%, it means that the company has given more money away as claims than what it has collected as premium. This is “unsustainable if persistent” for the company.
If ICR is less than 100% say in the range of 60% to 90%, it means that the health insurance company has given lesser amount as claims than what it has collected. It means that they are operating with surplus before expenses.
Important: IRDAI does not define this as an “ideal” range. It is a general market convention, not a regulatory benchmark.
If ICR is very low say less than 40%, it means that either the company is charging higher premium rates than its peers and making huge profits (or) it has a good pool of low-risk (may be youngsters) profile individuals as clients (or even both).
Hence it is better to be with an insurance company which has neither high nor low incurred claim ratio. I believe that the ideal ratio (percentage) range can be anywhere between 60% to 80%.
The main difference between Incurred Claims Ratio and Claim Settlement ratio is – Incurred Claim ratio is the ratio of the claims settled to the premium received. Claim Settlement Ratio (CSR) is the ratio of claims approved to total claims made (received). The higher the CSR the better. Same is not the case with ICR.
Top Non-Life & Health Insurance Companies based on Incurred Claims Ratio 2025
IRDA’s Latest Incurred Claims Ratio 2025 | Non-Life & Health
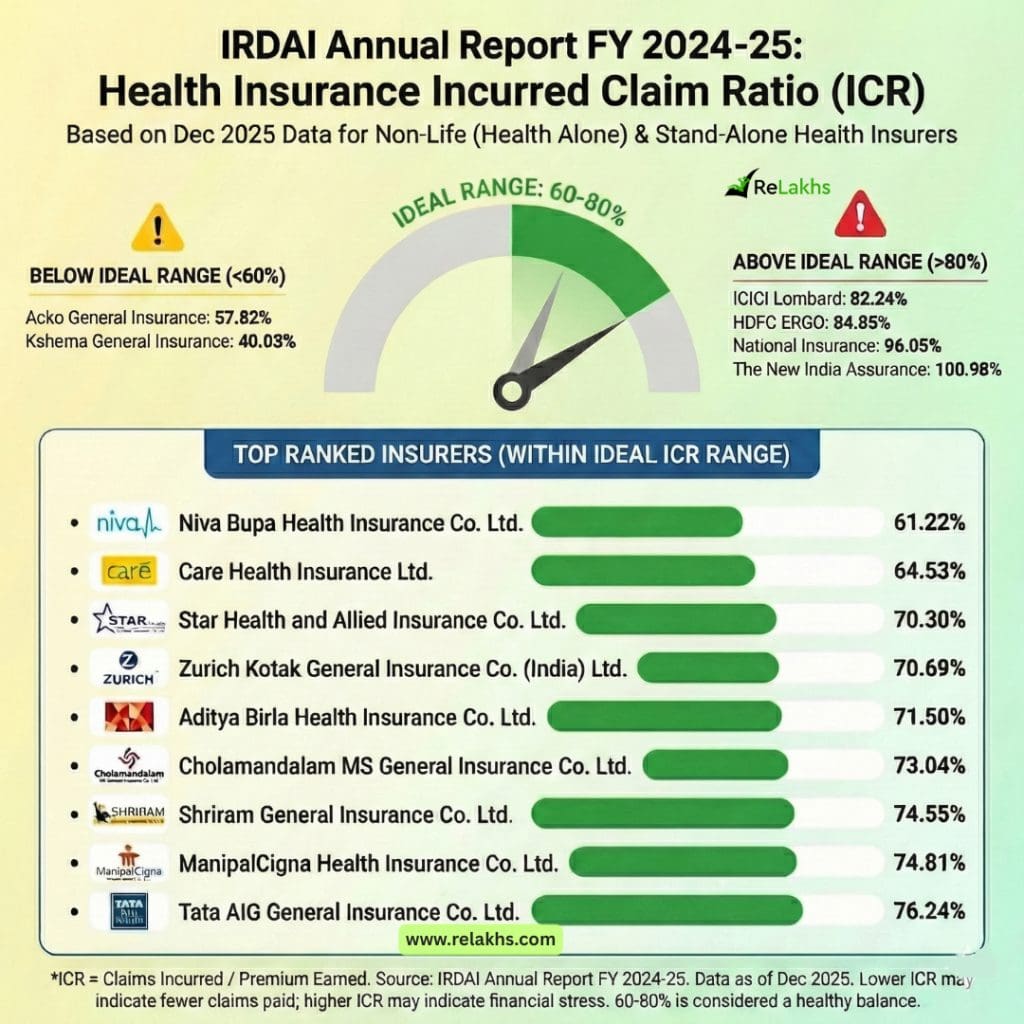
Based on IRDAI’s FY 2024-25 data (health insurance portfolios):
Insurers with ICR below 60%
Acko General Insurance – ~58%
Kshema General Insurance – ~40%
What this may indicate:
What this may indicate is lower claims relative to the premium collected. This situation can arise for several reasons, such as a younger or healthier customer base, stricter underwriting standards, or simply fewer claims being reported during the period.
However, a lower incurred claim ratio does not automatically imply poor claim settlement practices. It only signals that the insurer’s claim outgo is relatively low compared to premiums earned, which is a data point that warrants deeper analysis rather than quick conclusions.
Insurers within 60–80% range (often considered balanced)
Niva Bupa Health Insurance
Care Health Insurance
Star Health & Allied Insurance
Zurich Kotak General Insurance
Aditya Birla Health Insurance
Cholamandalam MS General Insurance
Shriram General Insurance
ManipalCigna Health Insurance
Tata AIG General Insurance
This range matters because industry analysts often view the 60–80% band as a balanced operating zone. In this range, insurers are generally paying claims on a regular basis, indicating active claim experience rather than minimal payouts.
At the same time, this level allows insurers sufficient room to manage operating expenses, maintain regulatory reserves, and absorb future risks, which is crucial for long-term sustainability.
Insurers with ICR above 80%
ICICI Lombard – ~82%
HDFC ERGO – ~85%
National Insurance – ~96%
The New India Assurance – ~101%
What high ICR may signal:
A high incurred claim ratio may signal heavy claim payouts relative to the premium collected, which can place significant stress on an insurer’s profitability. When such pressure continues over time, insurers may be compelled to increase premiums, tighten underwriting standards, or adopt stricter claim management practices in order to restore financial balance.
Important Notes on Incurred Claim Ratio (ICR)
The Incurred Claim Ratio (ICR) figures published in the IRDAI annual report are useful indicators, but they should not be interpreted in isolation. Below are some critical points every reader should understand before using ICR data to judge a health insurance company.
Please note that one-year ICR can be misleading. A single year’s ICR does not define an insurer’s long-term claim behavior. We need to observe ICR trends across multiple years for meaningful insights. A stable insurer with a predictable track record is usually preferable to one swinging between extremes.
For example :
This is where trend analysis over multiple years becomes far more meaningful. When we look at insurers like ICICI Lombard and HDFC ERGO, their ICRs in the latest IRDAI data for FY 2024-25 appear relatively high compared to some peers. However, these numbers did not emerge suddenly. Both insurers have shown gradual and consistent movement in their ICRs over several years, rather than sharp jumps or erratic swings.
For example, ICICI Lombard’s ICR has moved steadily from the mid-to-high 70% range in earlier years to just above 80% in the latest data. Similarly, HDFC ERGO has consistently operated in the higher-ICR zone, with a slow upward trend rather than extreme volatility. This kind of predictable progression suggests stable underwriting practices and mature portfolios, rather than reactive or stressed claim behaviour.
Financial Year
ICICI Lombard – ICR (%)
HDFC ERGO – ICR (%)
FY 2021–22
~76–78%
~78–80%
FY 2022–23
~77.3%
~80.9%
FY 2023–24
~78.8%
~82–83%
FY 2024–25 (Dec 2025)
~82.2%
~84.8%
Trend Pattern
Gradual increase
Gradual increase
From a policyholder’s perspective, a stable insurer with a predictable track record is usually preferable to one whose ICR fluctuates dramatically from year to year. Extreme swings — either very low one year or very high the next — often indicate pricing experiments, sudden portfolio changes, or operational stress. Consistency, even at slightly higher levels, generally reflects better visibility and long-term management discipline.
In short, ICR should be used as a long-term diagnostic tool, not a one-year verdict. Observing how insurers like HDFC ERGO and ICICI Lombard behave across multiple years reinforces why patterns matter more than point-in-time rankings.
A single-year ICR above 80% does not automatically indicate a red flag when:
The increase is gradual
The insurer has a history of stable operations
There are no extreme year-to-year swings
For both ICICI Lombard and HDFC ERGO, the data points toward consistency rather than stress, reinforcing why trend analysis matters more than one-year rankings.
ICR shows how much was paid, not how well – Two insurers can have the same ICR but very different claim experiences for policyholders.
Solvency Ratio :
Along with ICR trends, it is equally important to look at an insurer’s solvency ratio, which reflects its ability to meet long-term claim obligations. While ICR shows how much is being paid out relative to premiums, the solvency ratio indicates the financial buffer an insurer maintains to absorb future shocks. An insurer may have a higher ICR in certain years, but if it consistently maintains a strong solvency ratio above regulatory requirements, it signals financial resilience and stability. Therefore, ICR and solvency ratio should always be read together to gain a more complete and reliable picture of an insurer’s overall health.
A general insurer might have a lower solvency ratio because it is more efficient at generating profits across multiple lines (like Motor, Fire), whereas a stand-alone health insurance is “all-in” on healthcare, making it more vulnerable to sharp spikes in medical costs.
Latest IRDA Solvency Ratio data of Health Insurance (Non-life) 2025
How to buy best Health Insurance plan/policy?
When it comes to health insurance, there is no one-size fits-all plan that you can rely on. Medical Insurance is a contract based policy with legal jargon thrown in. Besides this, a Health Insurance policy has medical terminologies. Of the numerous medical insurance plans in the market, you may find that each one is unique in some way or the other, with its own benefits and limitations.
The Incurred Claim Ratio (or) Claim Settlement Ratio can help you in shortlisting the best health insurance companies but you have to do a lot of research to identify the right and best health insurance plan which suits your requirements. You have to make a comparison of health insurance plans offered by multiple companies. This is where I believe that health insurance comparison websites could be beneficial.
Kindly note that having a health insurance plan is not the end of your ‘medical insurance’ planning. In fact, it is your first-line of defense only. Considering the ever-increasing medical treatment expenses in India, you have to plan for a mediclaim /family floater + a Super top up plan + an Emergency fund for unforeseen consequences. Don’t depend entirely on health insurance plan alone!
Continue reading : All LIC Plans Return Analysis 2026 | How Much Do LIC Policies Really Return?
Disclaimer : This analysis is purely educational and based on publicly available IRDAI data. It does not constitute a recommendation to buy or avoid any specific insurance company. Policyholders should always: Read policy wordings carefully, Compare multiple parameters beyond ICR & Seek professional advice where required
(Post first published on : 12-Jan-2026)
Mitchell Brose
Mitchell Brose is a financial analyst and writer with a deep understanding of macroeconomic trends and stock market analysis. He graduated from the Massachusetts Institute of Technology (MIT) with a degree in Finance and has worked for several hedge funds and investment banks. Mitchell's analytical approach to finance allows him to break down complex topics into digestible insights for everyday investors. His content focuses on risk management, asset allocation, and retirement planning, making him a valuable resource for those looking to make informed financial decisions.